Everyone of us has already experienced an unexpected COMMIT in the middle of a posting routine, for example, that prevents the full rollback from happening whenever there’s an error.
You can always use the debugger to track the code and step into it, line after line, trying to find where the commit is. This will work but will consume a lot of time.
Ok, let’s do this the easy way then. Let’s use a good (new) friend of us… the SQL Profiler tool!
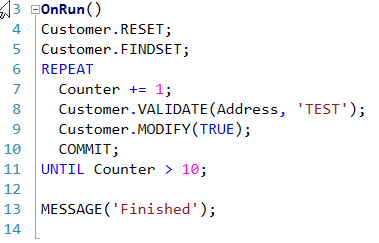
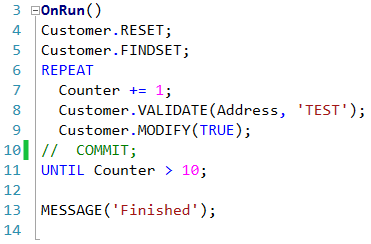
Here’s a simple codeunit that I’ve created which updates the address in the first 10 customers to “TEST” and commits each change every time.
Next, open SQL Profiler and prepare to run it.
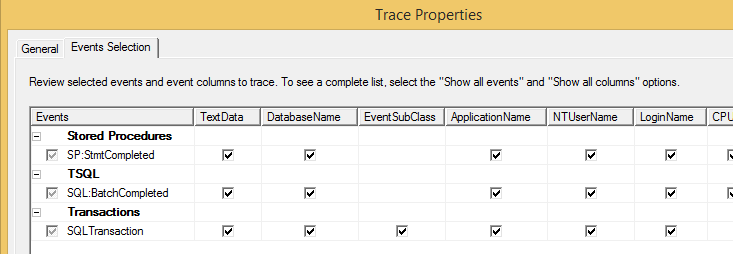
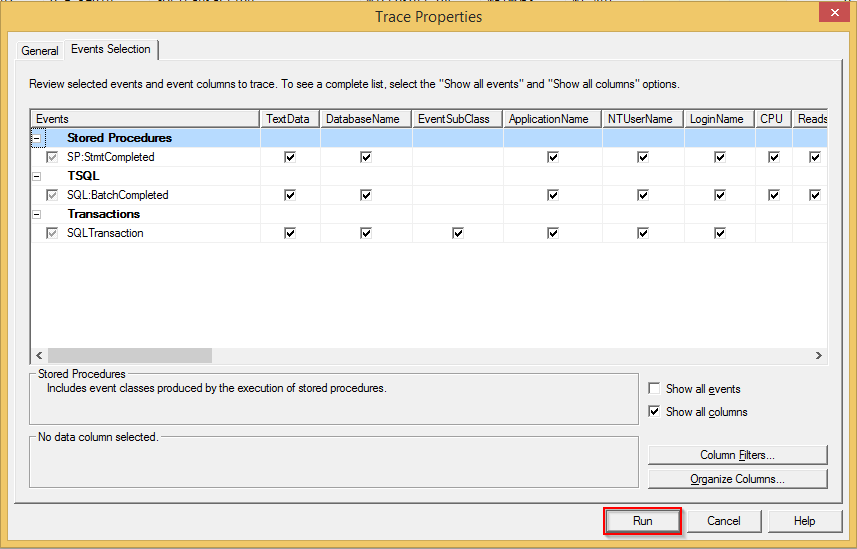
Create a new trace and select the following events and columns. You may choose others but these are the ones you need for this example.
UPDATE: SQLTransaction event shouldn’t be used because some commits transactions that didn’t occured may appear. Instead, you should use the following events:
-> TM: Begin Tran completed
-> TM: Commit Tran completed
-> TM: Rollback Tran completed
-> TM: Save Tran completed
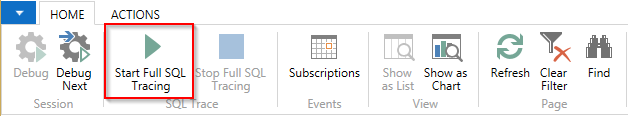
In Dynamics NAV 2013 (and higher) you have a nice feature called SQL Tracing that can be enabled in the NAV Debugger window. Activate it by pressing the “Start Full SQL Tracing” button:
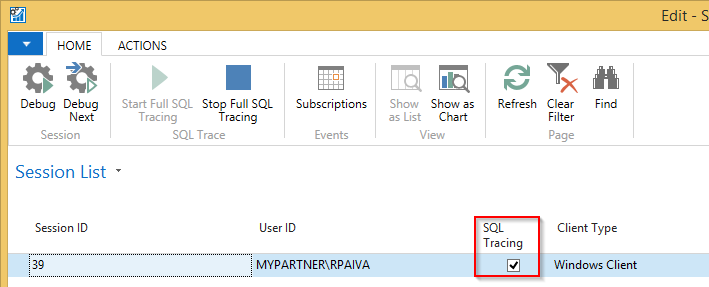
The SQL Tracing field is activated in the selected session.
Start the trace by pressing Run in the SQL Profiler:
Afterwards, run the codeunit in Microsoft Dynamics NAV Development Environment.
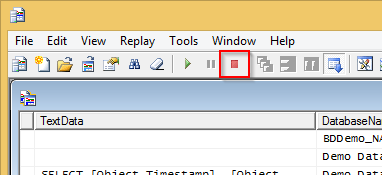
Next, stop the trace:
And now the analysis part:
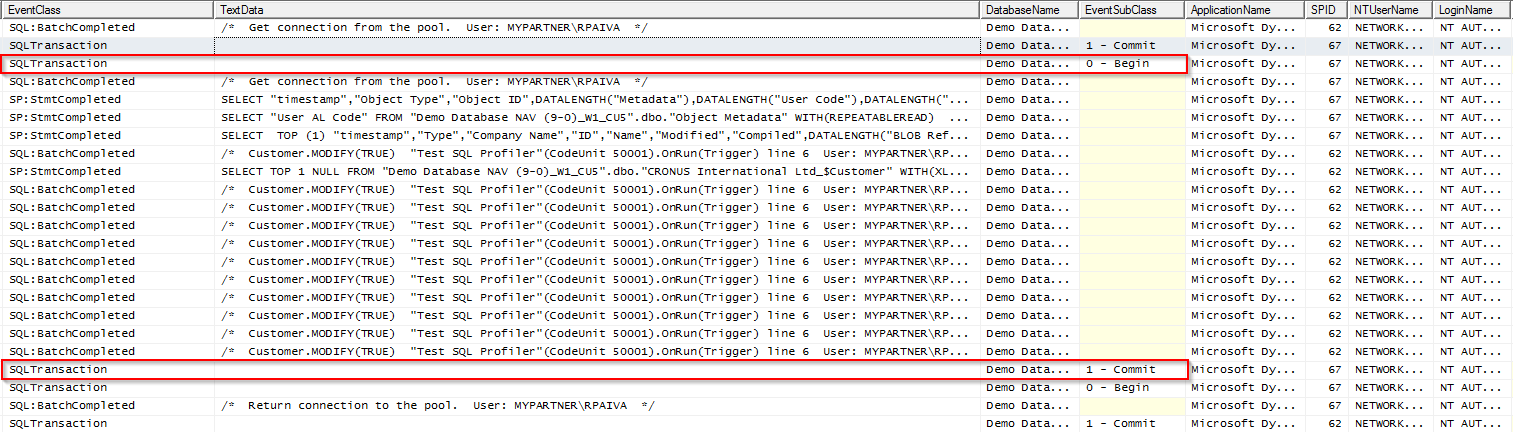
- In the EventClass type, SQLTransaction shows every transaction start (0 – Begin) and end (1 – Commit) – in red, in the image below.
- In the EventClass type, in the SQLBatchCompleted lines you can see the command being run in Dynamics NAV as well as the object and line. This happens because we’ve activated the SQL Tracing option in NAV Debugger session (great, ah?!) – in blue, in the image below.
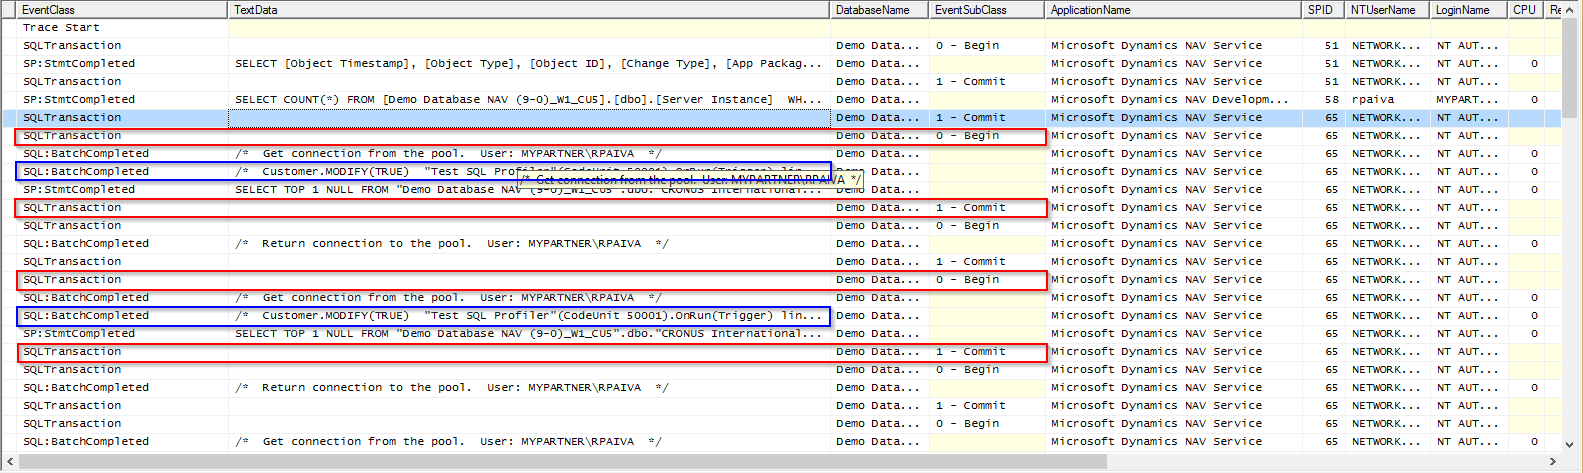
As we are looping through each customer and commiting the transaction every MODIFY, you have a few Begin/Commit lines, which matches each transaction.
Next, comment the COMMIT line in the codeunit and run the trace again to see the differences.
In this case, you have the beginning of the transaction, followed by all the MODIFYs in the customer’s record and the commit in the end.
Finally, all you have to do is to use this with your posting routine and identify the beginning and the end of the transaction(s), looking for unexpected commits during the routine. As you have the SQL:BatchCompleted event activated, commands being run in Dynamics NAV are shown so you can easily find the object and line where the COMMIT is.
Please feel free to ask me questions or to comment this article.
Note: I guess you’re familiar with SQL Profiler, so I don’t have too much detail regarding how to choose the events or the columns, etc.