Hi,
In LS Retail, quite often I help partners looking into their customer’s telemetry to solve issues related to deadlocks, performance and other reasons.
Although is not always easy to spot the root cause for some of the issues, telemetry is a great way to start and get a good overview on the environment and quite often provides you with helpful insights.
These days we had a partner reporting a 409 Conflict error when replicating sales prices using Web Replication. Web Replication is a feature included in LS Central, that allows you to replicate data between different companies in the same environment, and it uses OData v4 web services under the hood.
If you have a look at Microsoft documentation, the 409 Conflict error means that there’s a conflict because other process, other than the web service call, has changed the same record – or it might also be because there’s a deadlock time out.
The big question is… but how will I be able to spot what other process have changed the record (or is causing the table to be locked for too long?
Well, I started digging at telemetry, to see if I couldn’t find something useful there.
First step was to connect the Application Insights resource to the Power BI app provided by Microsoft (https://learn.microsoft.com/en-us/dynamics365/business-central/dev-itpro/administration/telemetry-power-bi-app#app-on-environment-telemetry).
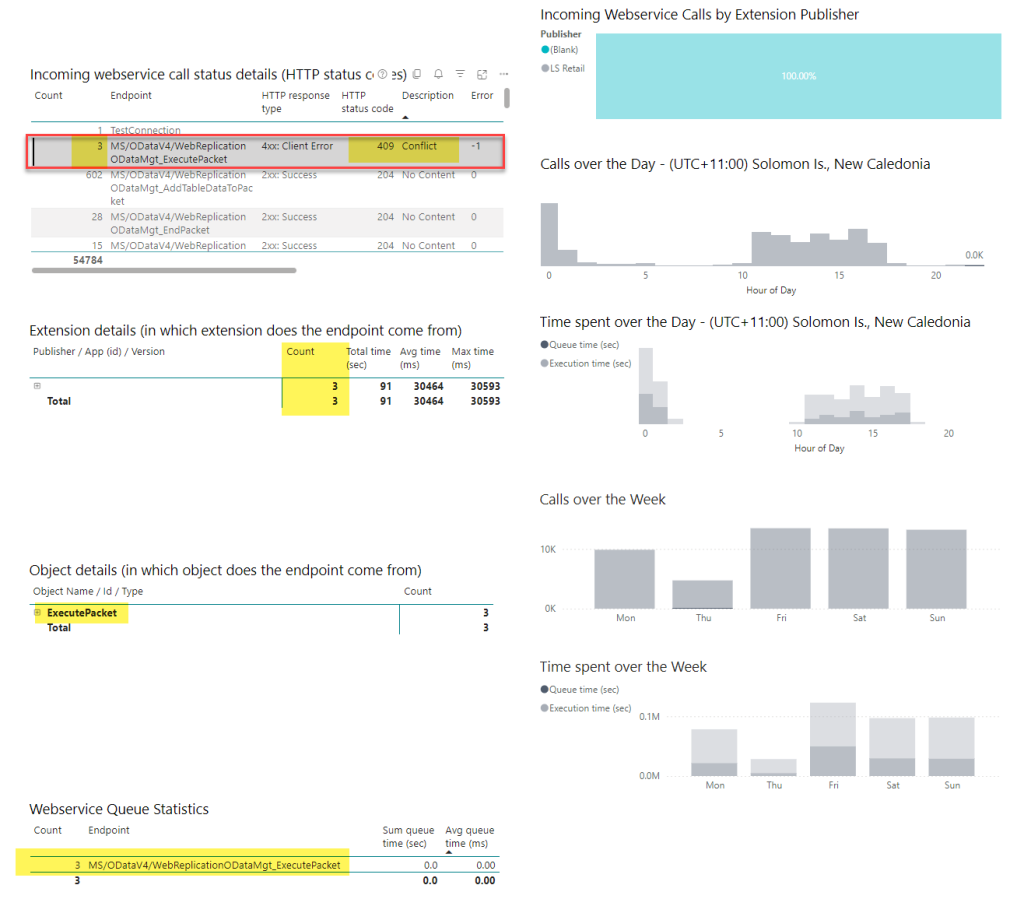
Incoming Web Services Calls page in PowerBI app
I looked at the Incoming Web Services Calls page in the Power BI app.
I could spot three (3) occurrences of the error:
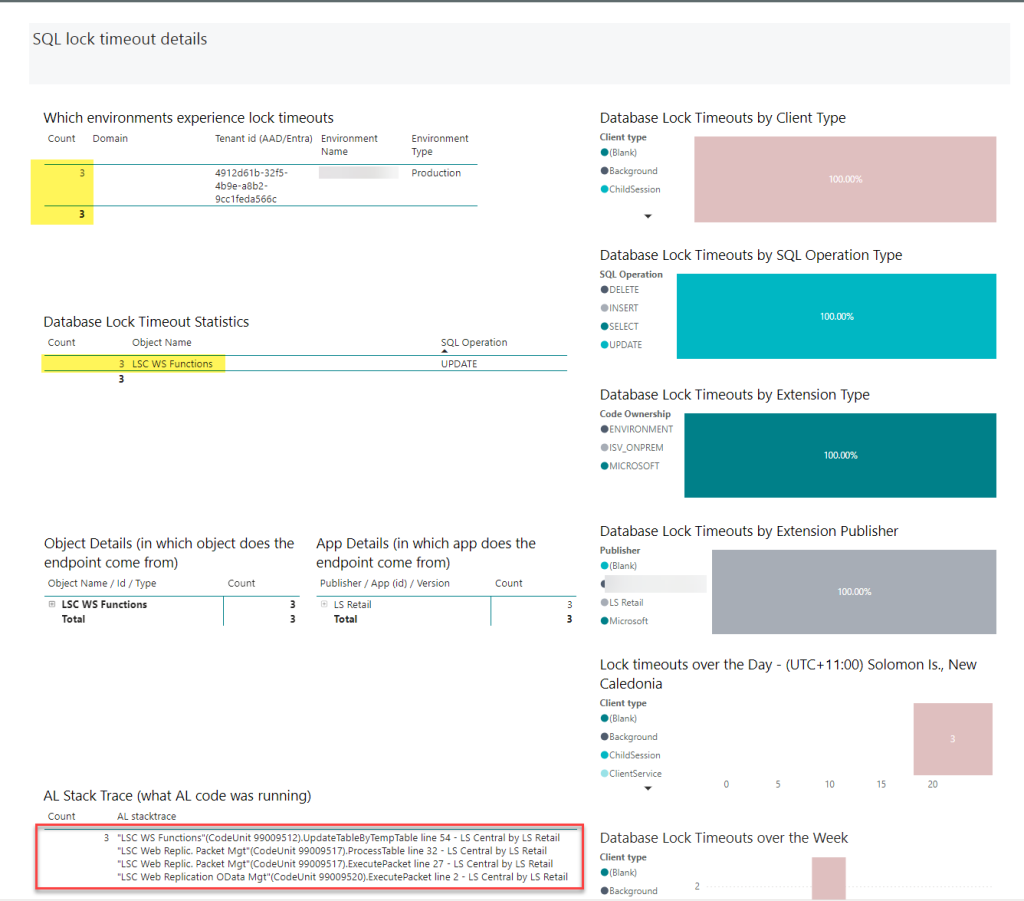
Database lock timeouts page in PowerBI app
I looked at the Database lock timeouts page in the Power BI App.
I could spot three (3) occurrences (same number of occurrences as for the 409 Conflict in the Web Services Calls page) and, in the AL Stack Trace, I could see that it was related to the LSC Web Replication OData Mgt codeunit, that is used in the Web Replication feature.
Application Insights resource in Azure Portal
To go a bit deeper into this analysis, i opened the Application Insights resource in the Azure Portal, to run some KQL queries.
Database lock timed out events (RT0012)
To list the Database lock timed out events (RT0012), i ran the following KQL query:
// lock timeouts (raw data)
traces
| where timestamp > ago(30d) // adjust to your needs
| where customDimensions.eventId == ‘RT0012’
| project timestamp
, componentVersion = customDimensions.componentVersion
, environmentType = customDimensions.environmentType
, environmentName = customDimensions.environmentName
, aadTenantId = customDimensions.aadTenantId
, alObjectId = customDimensions.alObjectId
, companyName = customDimensions.companyName
, clientType = customDimensions.clientType
, alObjectType = customDimensions.alObjectType
, alObjectName = customDimensions.alObjectName
, extensionVersion = customDimensions.extensionVersion
, extensionName = customDimensions.extensionName
, extensionId = customDimensions.extensionId
, alStackTrace = customDimensions.alStackTrace
// use the KQL snippet parseStackTrace to get bottom of the stack trace details
, sqlStatement = customDimensions.sqlStatement
, sqlServerSessionId = customDimensions.sqlServerSessionId
, snapshotId = customDimensions.snapshotId
, sessionId = customDimensions.sessionId
, usertelemetryId = case(
// user telemetry id was introduced in the platform in version 20.0
toint( substring(customDimensions.componentVersion,0,2)) >= 20, user_Id
, ‘N/A’
)
The output was:
The conflicts seems to be related to the Item table being updated (and/or locked).
Joining Lock timeout events (RT0012) with the Lock snapshot events (RT0013)
The telemetry you see for lock timeouts only represents the session that is the victim in a locking issue, not the sessions that hold the locks. When analyzing database lock timeout telemetry, it’s therefore useful to look at combined data from the Database lock timed out event and Database lock snapshot events. You might be lucky that the snapshot has captured information from locks that were held when the lock timeout occurred.
From Microsoft documentation: https://learn.microsoft.com/en-us/dynamics365/business-central/dev-itpro/administration/telemetry-database-locks-trace#troubleshooting-locking-issues-with-telemetry
I ran the following KQL query to combine data from different events (RT0012 and RT0013) by using joins.
// this query shows how to join lock timeout events (RT0012) with the lock snapshot events (RT0013)
let Timeouts =
traces
| where timestamp > ago(30d) // adjust to your needs
| where customDimensions.eventId == ‘RT0012’
| extend snapshotId = tostring( customDimensions.snapshotId )
// add filters on AAD id and environment name if needed
//, aadId = customDimensions.aadTenantId
//, environmentName = customDimensions.environmentName
//| where aadId == ‘abc’
//| where environmentName == ‘def’
| project snapshotId, message, timestamp
, alObjectIdLockTimeout = customDimensions.alObjectId
, alStackTraceLockTimeout = customDimensions.alStackTrace
, sqlTableLockTimeout = customDimensions.sqlTableName
, usertelemetryId = case(
// user telemetry id was introduced in the platform in version 20.0
toint( substring(customDimensions.componentVersion,0,2)) >= 20, user_Id
, ‘N/A’
)
;
Timeouts
| join (traces
| where customDimensions.eventId == ‘RT0013’
| extend snapshotId = tostring( customDimensions.snapshotId )
| project snapshotId
, alObjectIdHoldingLock = customDimensions.alObjectId
, alStackTraceHoldingLock = customDimensions.alStackTrace
, sqlTableLocked = customDimensions.sqlTableName
)
on $left.snapshotId == $right.snapshotId
| order by snapshotId
| project-away snapshotId, snapshotId1
The output was:
These insights allowed me to tell the partner that most likely the 409 Conflict error is being caused by some code in their extension, that might be updating the Item table and/or causing this table to be locked for too long.
It is now up to them to look and review their own code and find the culprit but, if we had no access to telemetry, it would be a challenge to have some clue on what was possible causing the 409 Conflict and where to start looking at.
Most likely some debugging would be required but it would be like finding a needle in a haystack and would take longer to find the root cause.
This was just other example on how telemetry enable me to help partners finding the root cause for issues on SaaS (although is also applicable for on-premises implementations).
If you would like to hear more about telemetry and how to troubleshoot issues on SaaS, please let me know.


