Two posts in a row.
I’ve just shared a post on how to give access to an user that belongs to a different Azure Active Directory to somehow workaround the limitation of only being able to setup one Application Insights in the same environment.
At LS Retail (an Aptos Company) I’ve been using telemetry to troubleshoot upgrades and performance issues on a SaaS environment and we need to have access to customer telemetry.
Microsoft has created an excellent Power BI app that give us a lot of insights. Start using it now: BCTech/samples/AppInsights/PowerBI/Reports/AppSource at master · microsoft/BCTech (github.com)
But if you need some more advanced features like exploring telemetry data using pivot tables in Excel, for example, then take a look at this post.
I’ve created a sort of template Excel file where I included Power Queries to get the telemetry data from Azure Application Insights.
And bear in mind that I want it to be dynamic. I want to change some paramenters like Application Insights ID, the Azure AD ID or the Environment Name in a easy and fast way.
Below it’s a step-by-step guide on how I’ve created an Excel spreadsheet and I’ve included the Long Running AL queries telemetry.
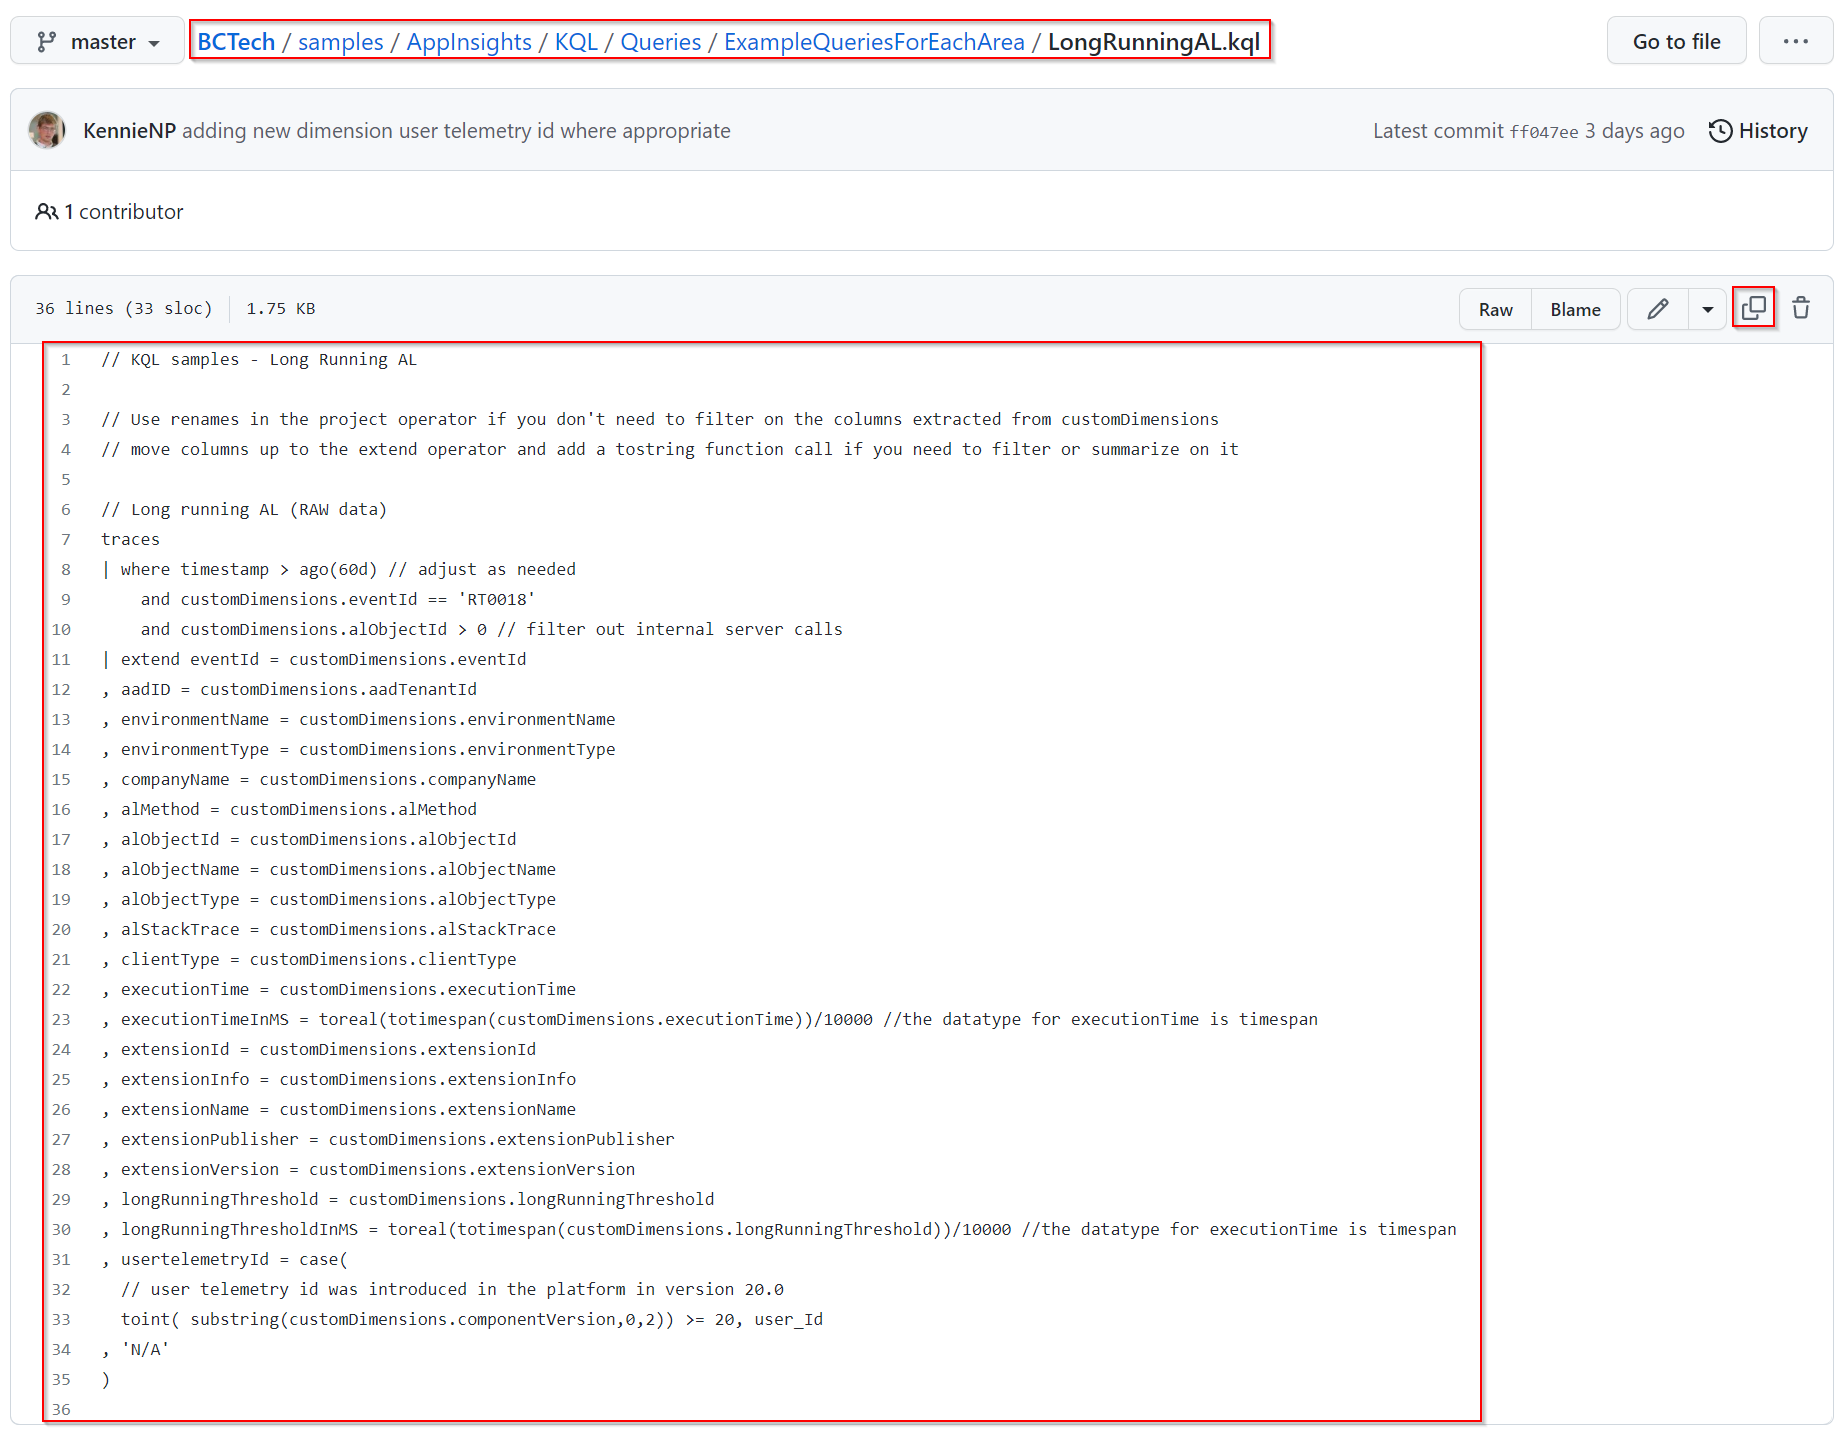
First, open the BCTech repo by Microsoft. There’s a KQL query example for pretty much all the telemetry events available. I chose the Long Running AL queries KQL query for this example.
https://github.com/microsoft/BCTech/blob/master/samples/AppInsights/KQL/Queries/ExampleQueriesForEachArea/LongRunningAL.kql
Copy the content to be used in Application Insights Logs.
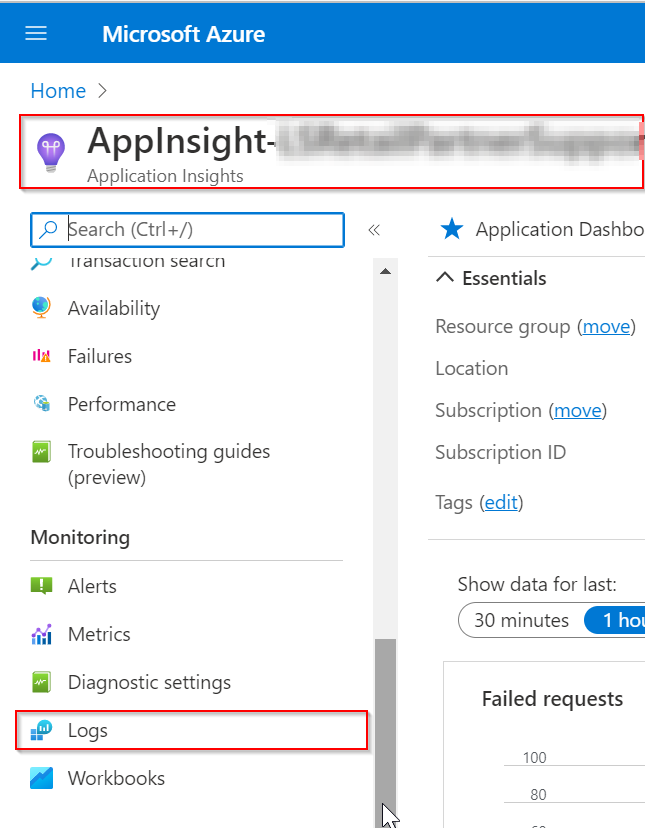
Open Logs under the Application Insights and paste the query:
You must run the query once to be able to use the Export button:
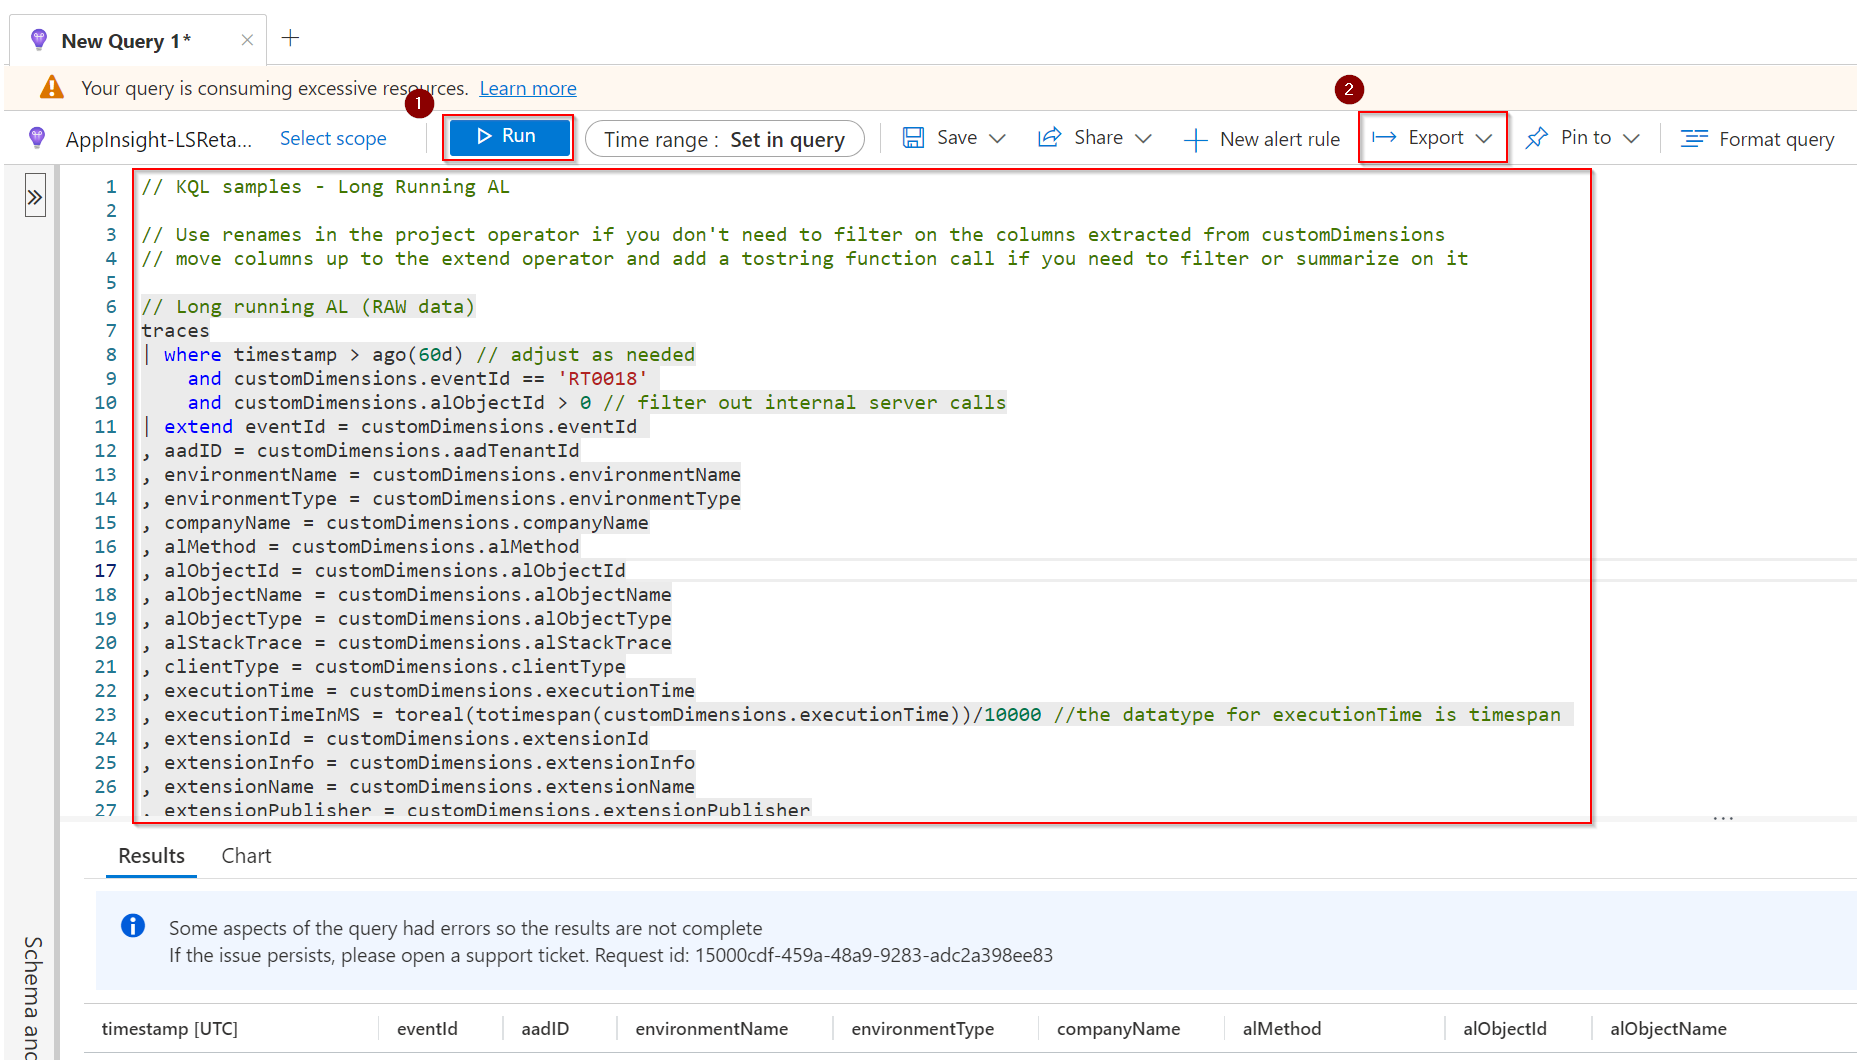
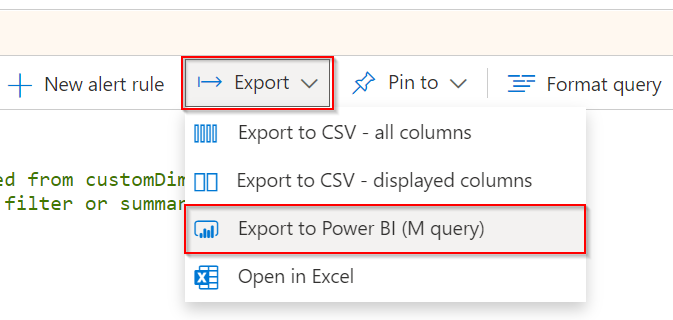
Choose the Export to Power BI (M query) to export the query ready to be used in Power Queries, in Excel. A text file is exported.
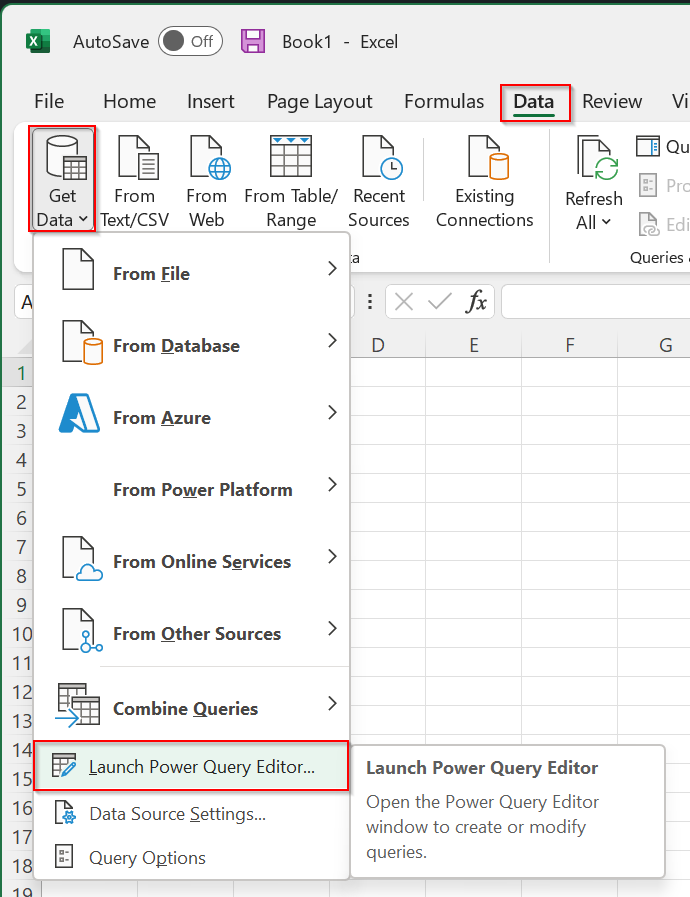
Next, open a new or an existing Excel file and go to Data – Get Data – Launch Power Query Editor…
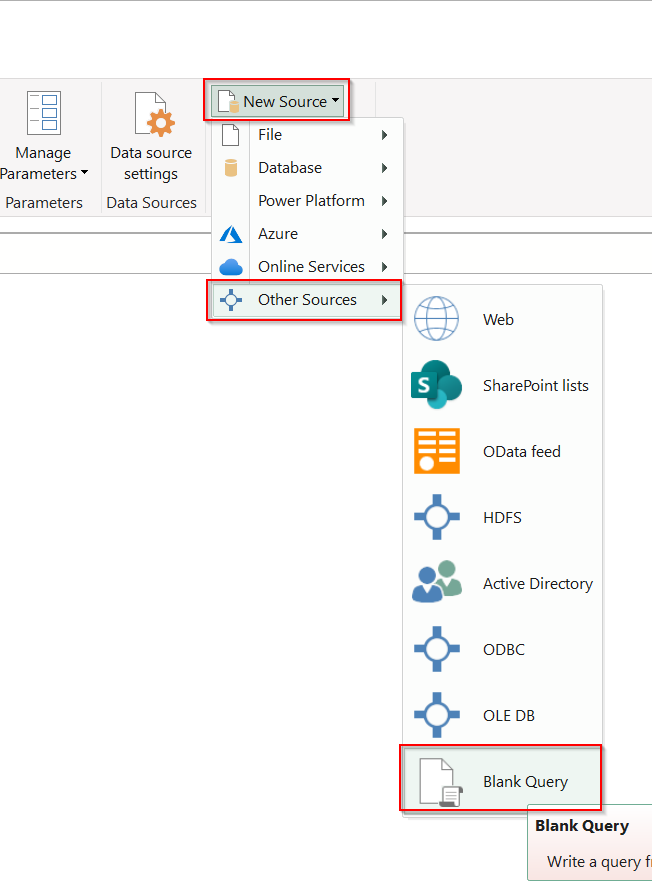
Create a new empty query:
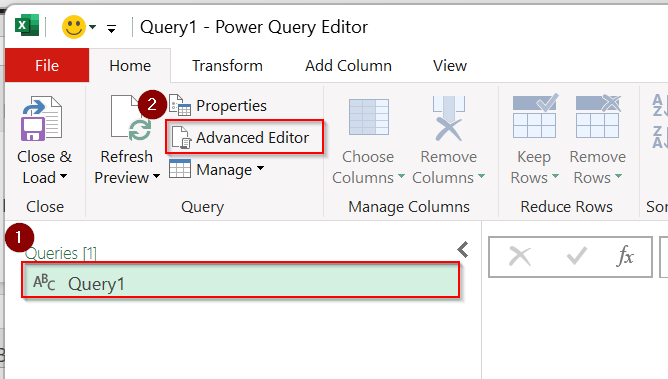
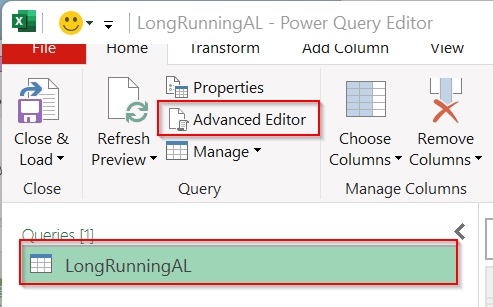
Edit the query using the Advanced Editor.
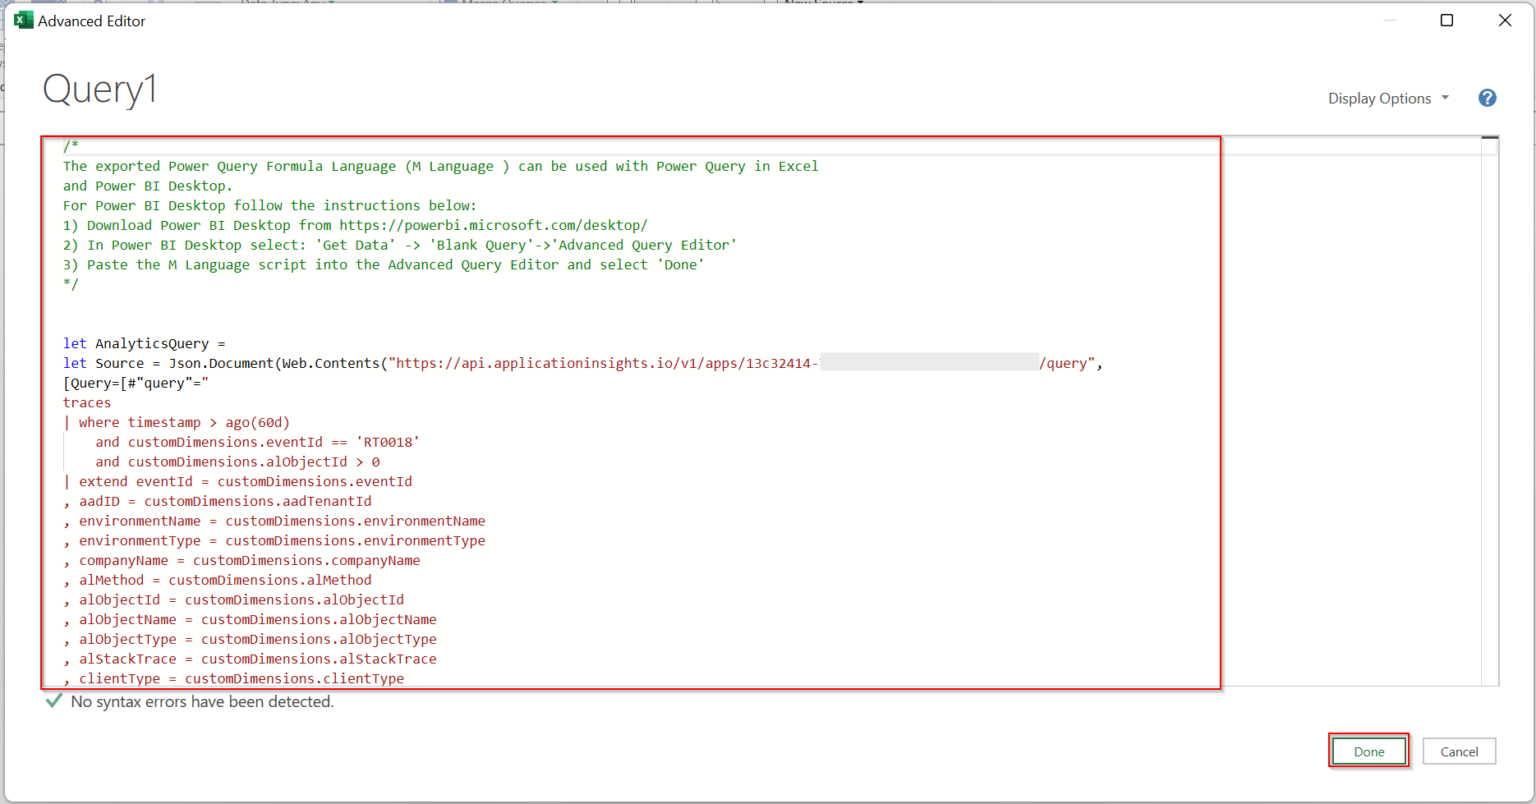
And replace the content of the query with the PowerBI query file downloaded from Application Insights.

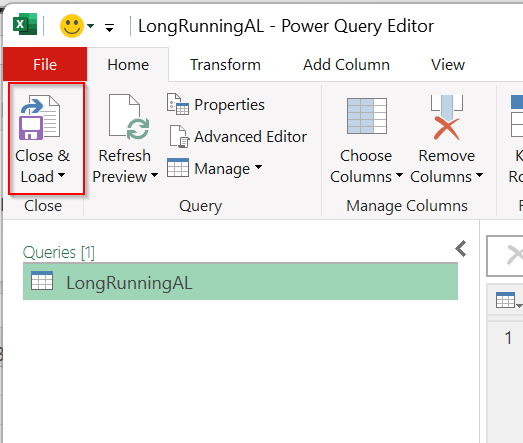
Right click and rename the query to a more user friendly name:
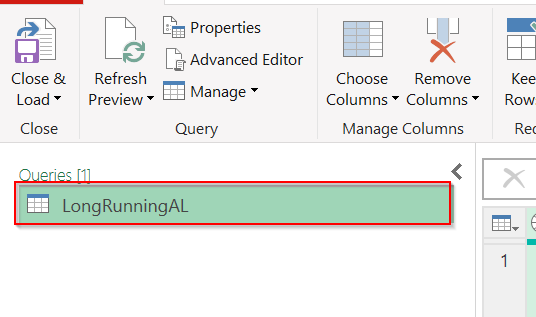
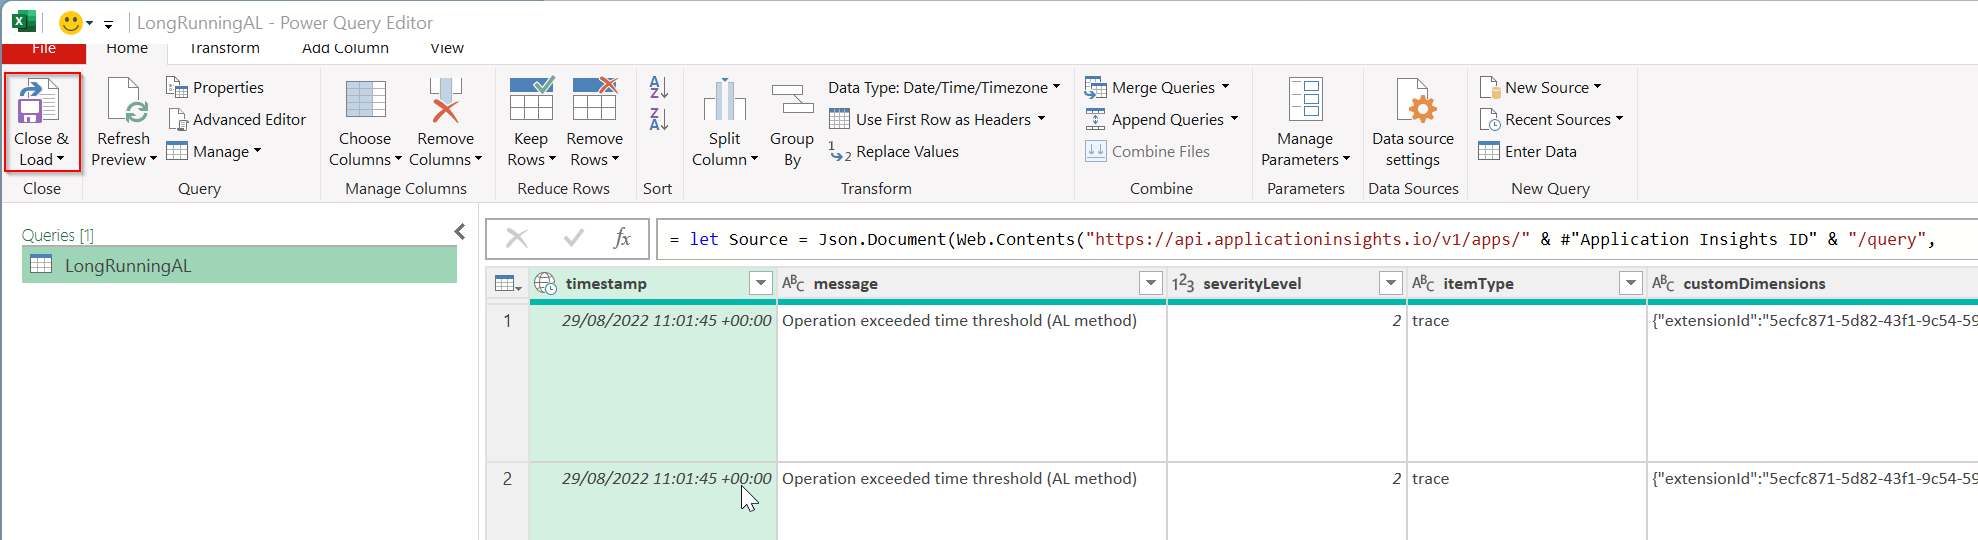
Close and load the results to Excel.
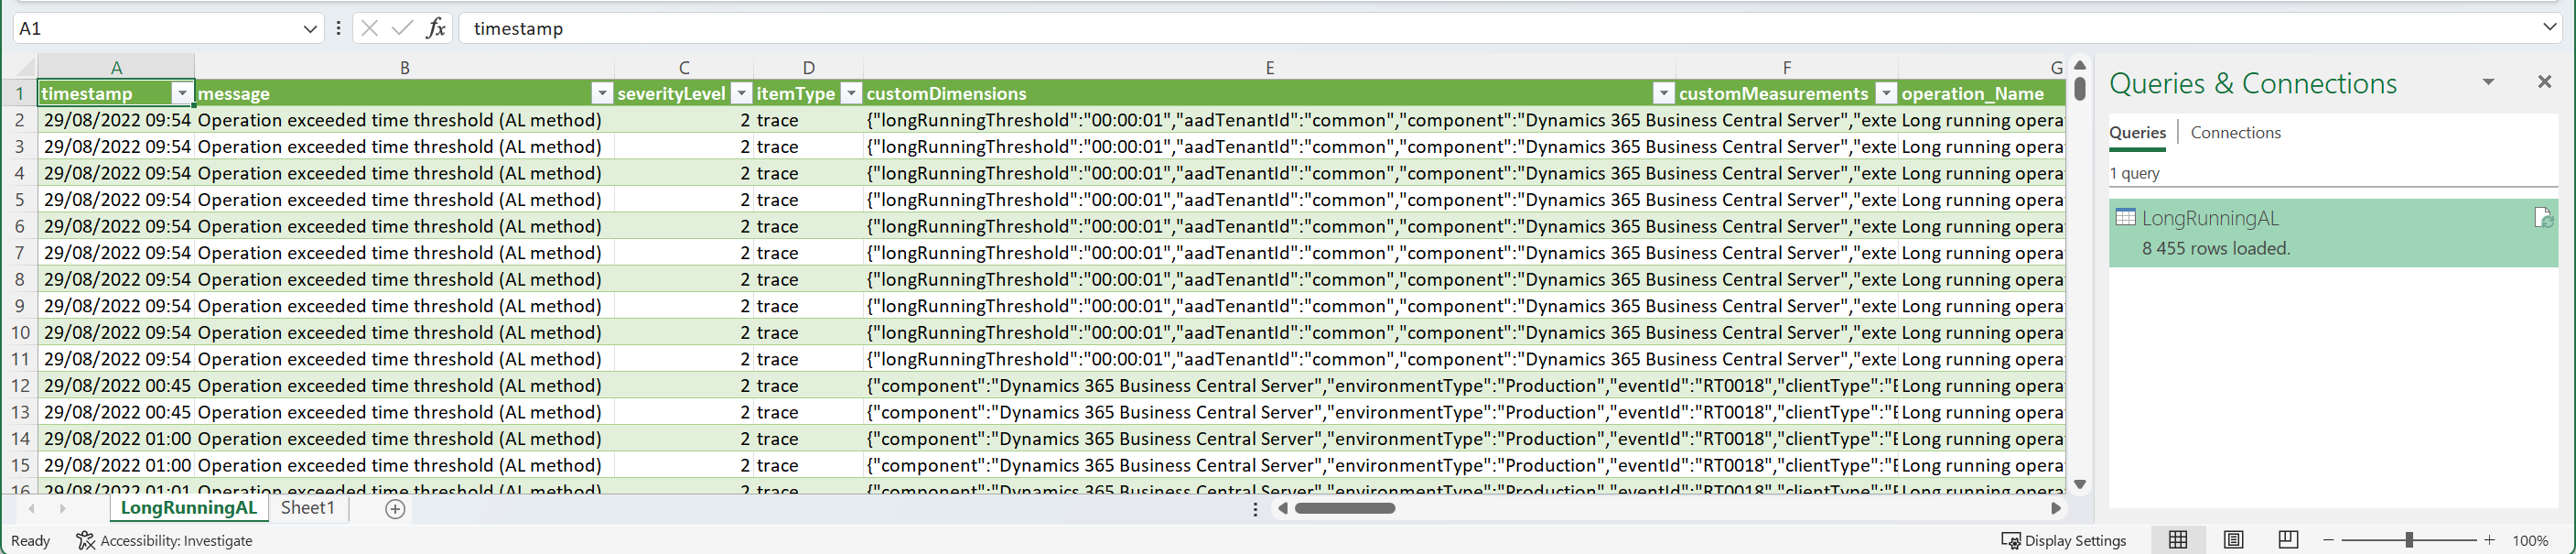
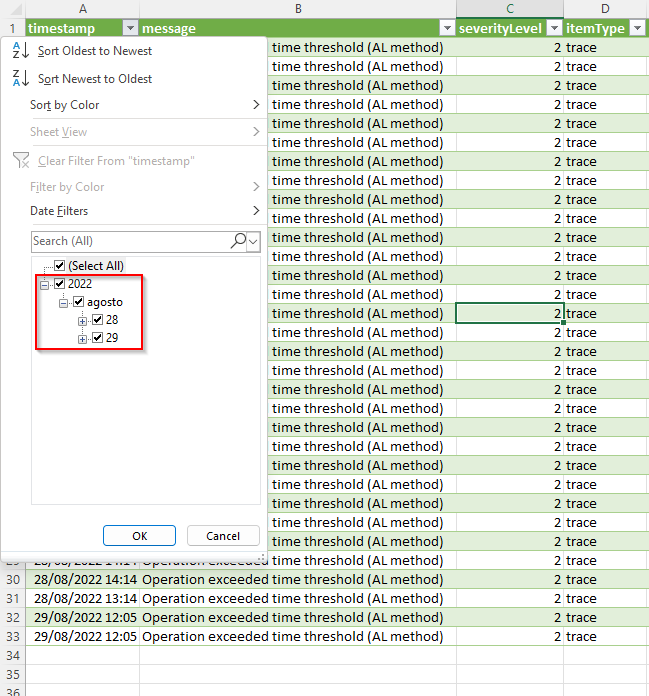
This is how it looks in Excel
Now you have to repeat this to as many queries as you want/need.
I told you earlier that I wanted this to be dynamic. I want to be able to change the Application Insights ID, the Azure AD ID or the Environment Name directly in a Excel sheet. Let’s look at this tricky part.
Create a new sheet and name it Parameters, for example.
Next, create a table with the parameters to be defined:
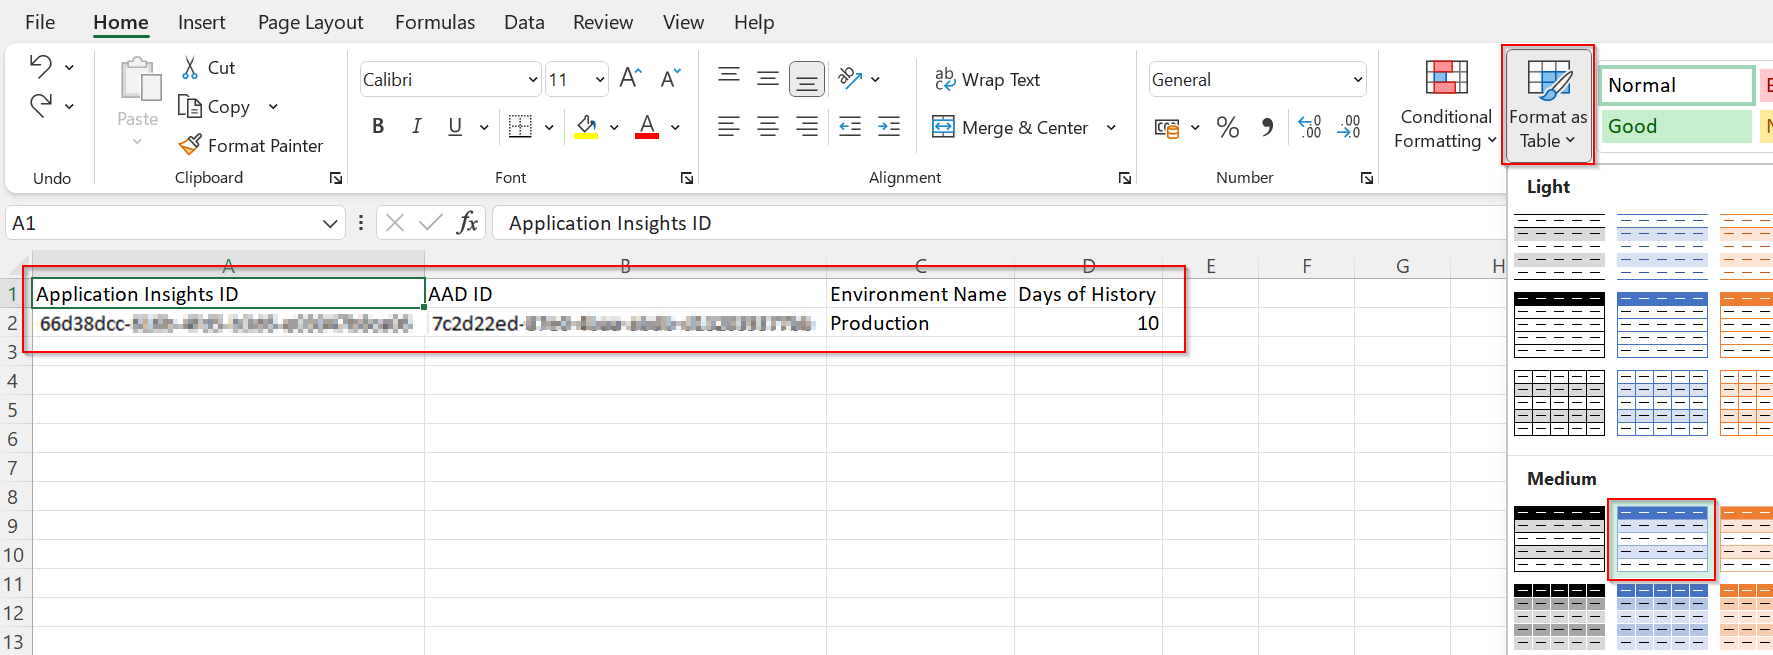
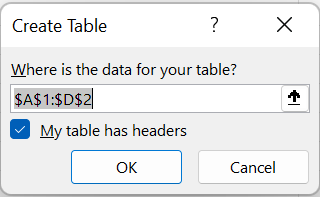

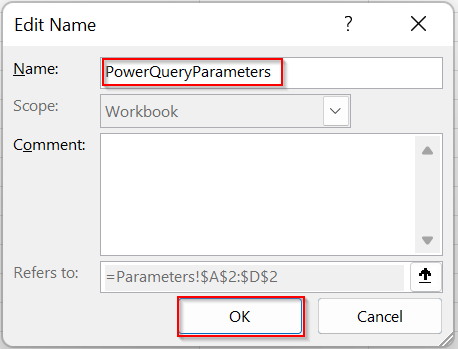
Time to give a friendly name to this table.
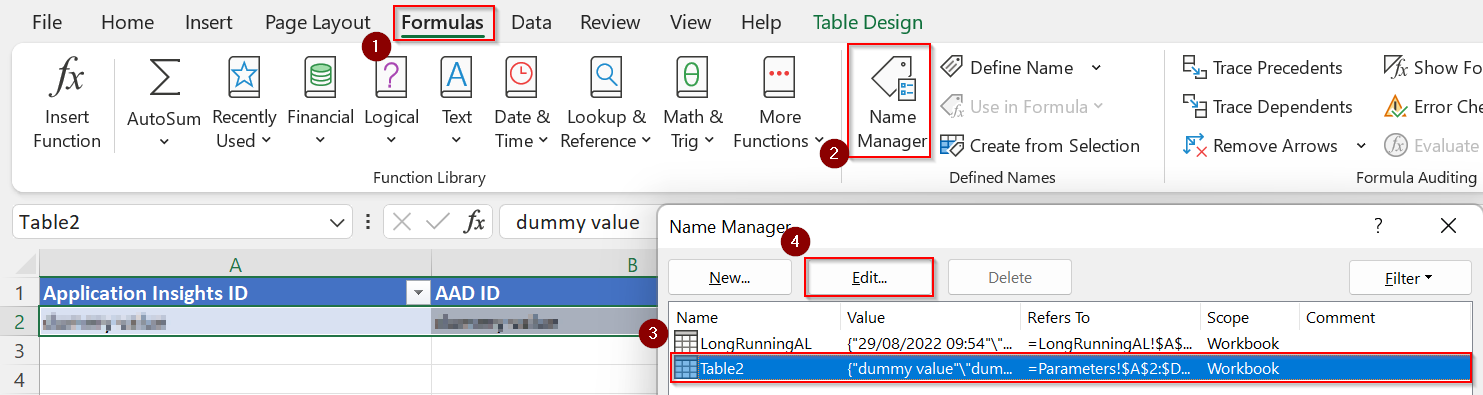
Next we need to link these fields with parameters created in Power Query.
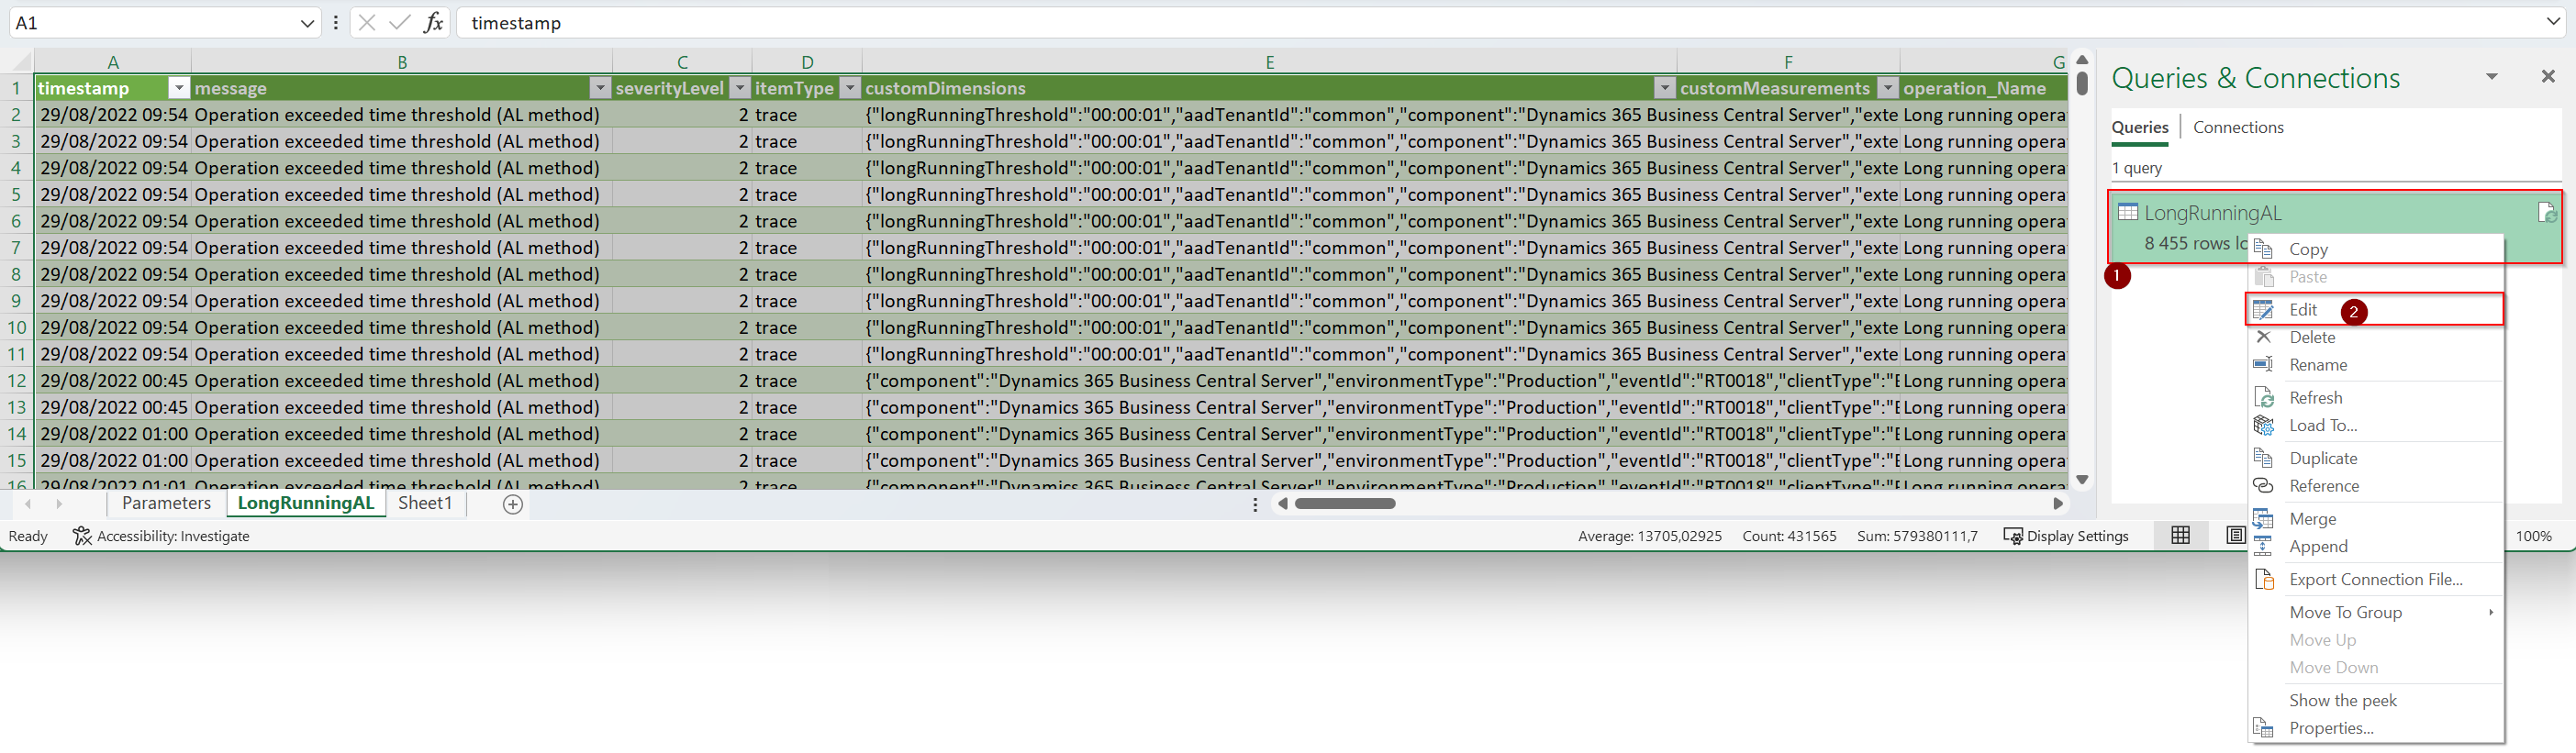
To access the Power Query, go to LongRunningAL sheet, access the Queries & Connections, right click the query and click on Edit.
Open the Advanced Editor
Now this is the trickiest part. We need to change the query to include the parameters in the table.
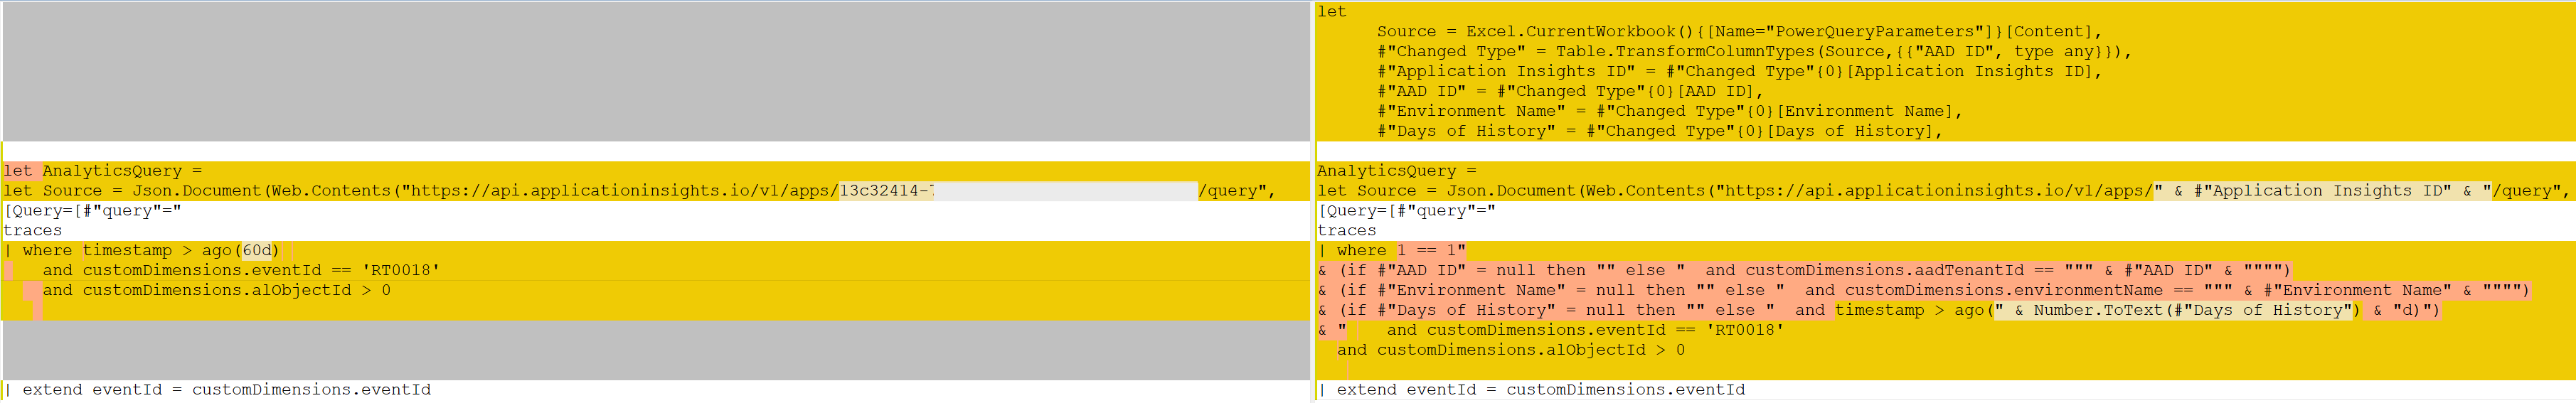
So, this is the beginning of the query before:
let AnalyticsQuery =
let Source = Json.Document(Web.Contents(“https://api.applicationinsights.io/v1/apps/13c32414-7067-xxxx-xxxx-xxxxxxxxxxxx/query”,
[Query=[#”query”=”
traces
| where timestamp > ago(60d)
and customDimensions.eventId == ‘RT0018’
and customDimensions.alObjectId > 0| extend eventId = customDimensions.eventId
And here’s the beginning of the query after:
let
Source = Excel.CurrentWorkbook(){[Name=”PowerQueryParameters”]}[Content],
#”Changed Type” = Table.TransformColumnTypes(Source,{{“AAD ID”, type any}}),
#”Application Insights ID” = #”Changed Type”{0}[Application Insights ID],
#”AAD ID” = #”Changed Type”{0}[AAD ID],
#”Environment Name” = #”Changed Type”{0}[Environment Name],
#”Days of History” = #”Changed Type”{0}[Days of History],AnalyticsQuery =
let Source = Json.Document(Web.Contents(“https://api.applicationinsights.io/v1/apps/” & #”Application Insights ID” & “/query”,
[Query=[#”query”=”
traces
| where 1 == 1″
& (if #”AAD ID” = null then “” else ” and customDimensions.aadTenantId == “”” & #”AAD ID” & “”””)
& (if #”Environment Name” = null then “” else ” and customDimensions.environmentName == “”” & #”Environment Name” & “”””)
& (if #”Days of History” = null then “” else ” and timestamp > ago(” & Number.ToText(#”Days of History”) & “d)”)
& ” and customDimensions.eventId == ‘RT0018’
and customDimensions.alObjectId > 0| extend eventId = customDimensions.eventId
Just to spot the differences:
Just Close & Load the Power Query Editor after you’ve done the changes.
That’s it.
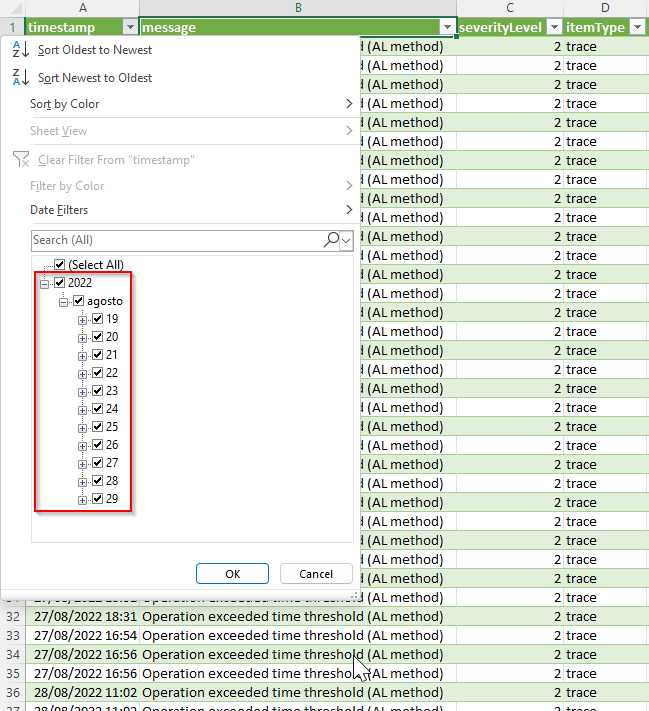
Now you just need to change the parameters and refresh the sheets. If you have multiple sheets, it’s a good idea to use the Refresh All button, under Data to refresh them all.
Example 1
Parameters
10 days of history
Example 2
Parameters
1 day of history (will show the last 24 hours)

Please note that I’ve created another Excel file (out of scope of this article) where I’ve included all the Pivot tables I need to analyse all connected to the Excel file with the queries so that I just need to update the parameters, hit refresh and all the information will be updated on both files, just like that.
If you don’t want to start from scratch, you can download this template file that you can use for testing or adding new telemetry events.
The following events have been included here:
- Timeline (BCTech/Timeline.kql at master · microsoft/BCTech (github.com))
- Long Running AL Methods (BCTech/LongRunningAL.kql at master · microsoft/BCTech (github.com))
- Long Running SQL Queries (BCTech/Long Running SQL Queries.kql at master · microsoft/BCTech (github.com))
- Incoming Web Services Requests (BCTech/WebServiceCalls.kql at master · microsoft/BCTech (github.com))
- Job Queue Entry Started (BCTech/JobQueue.kql at master · microsoft/BCTech (github.com))
- Job Queue Entry Finished (BCTech/JobQueue.kql at master · microsoft/BCTech (github.com))
I hope you enjoyed this article and found it useful.
Please feel free to comment.
#businesscentral #telemetry #applicationinsights #azure #excel